COVID-19 information for: Families of prisoners People reporting to Community Corrections Stakeholders
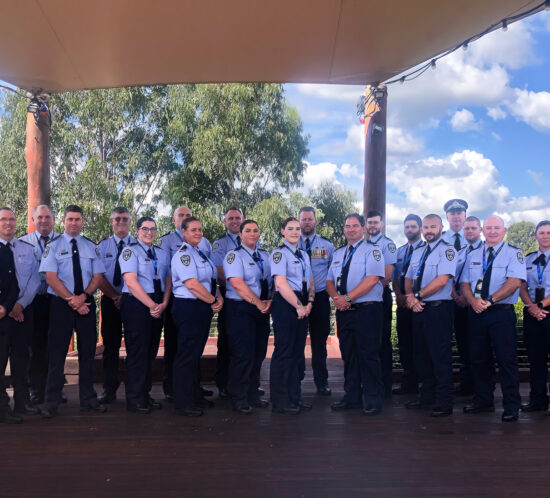
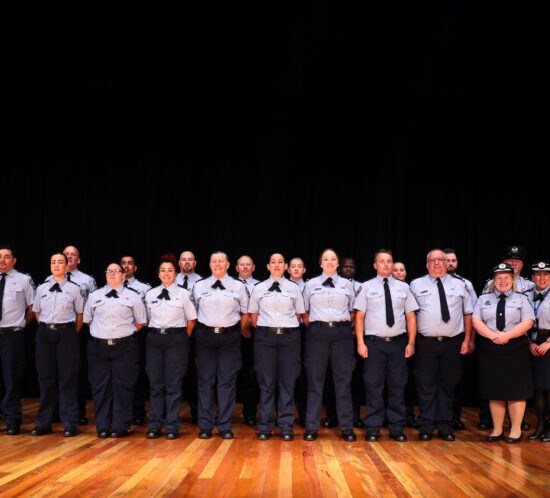
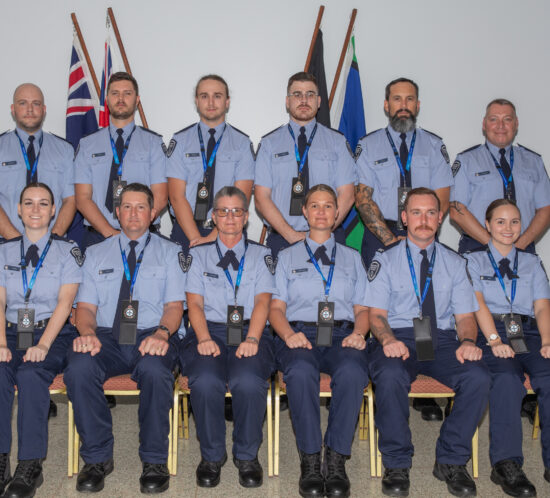
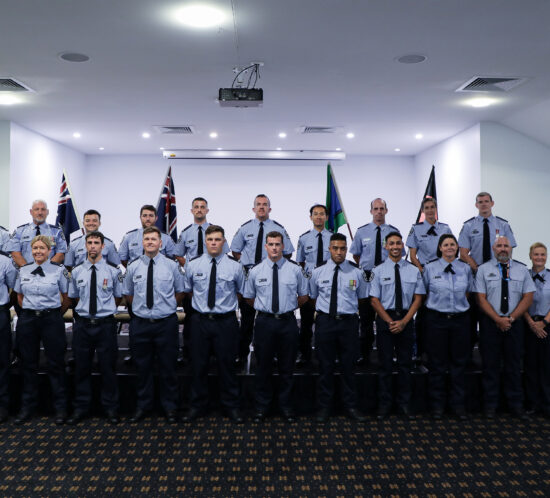
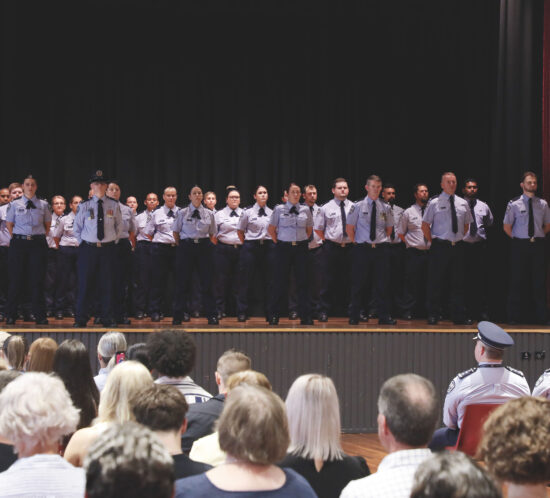
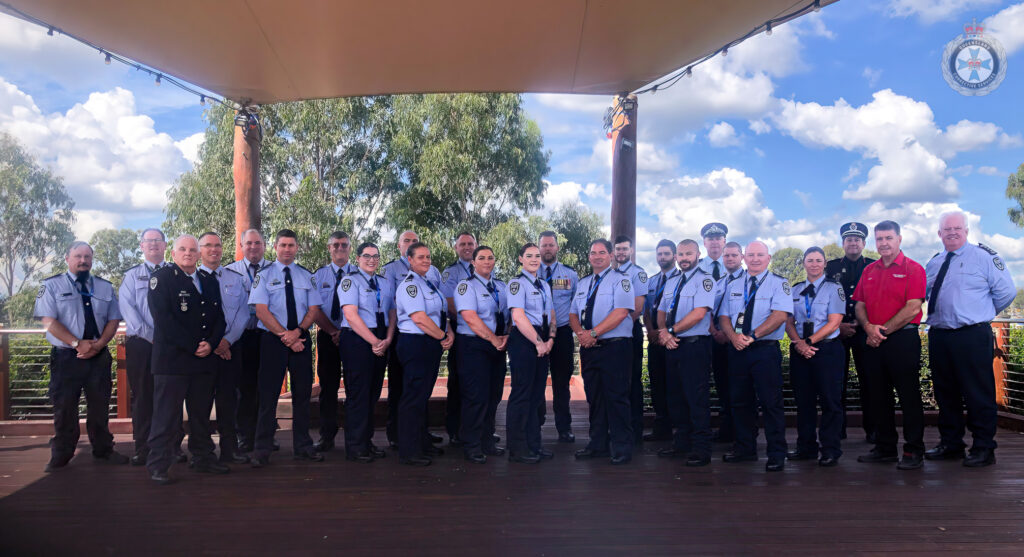
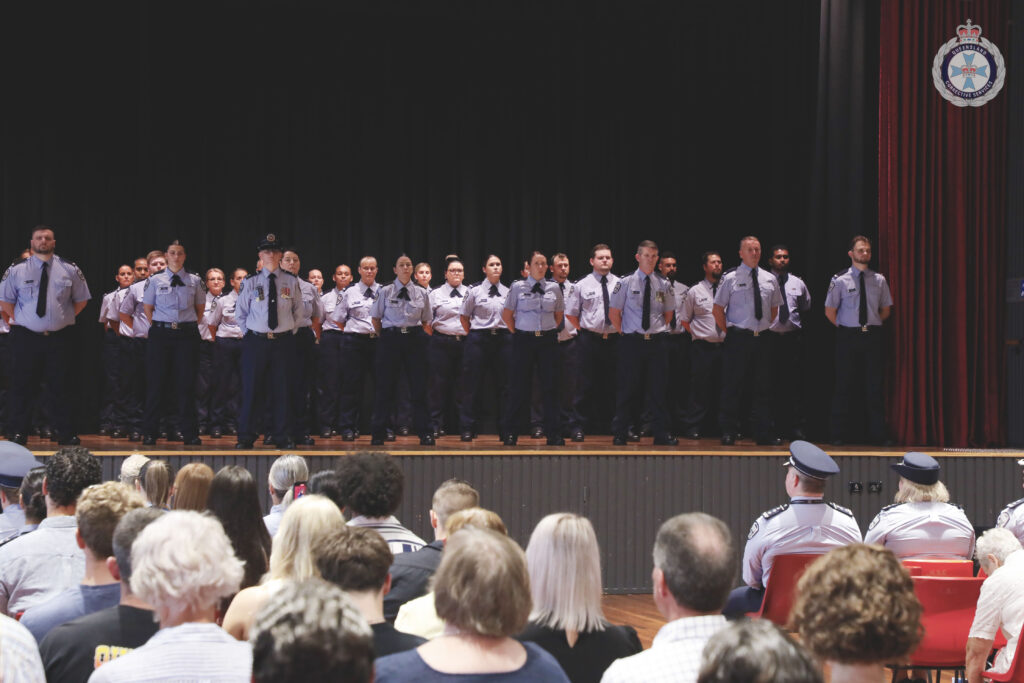
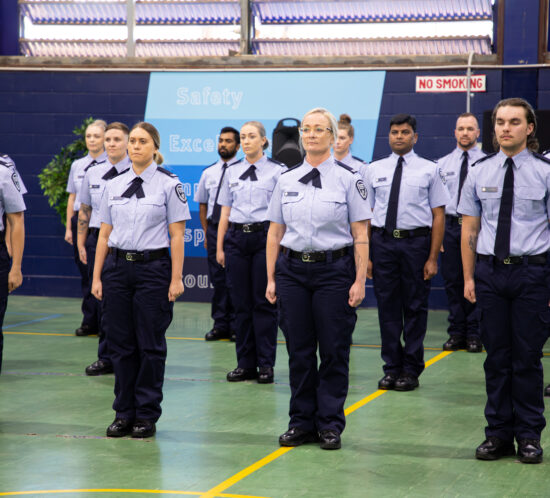
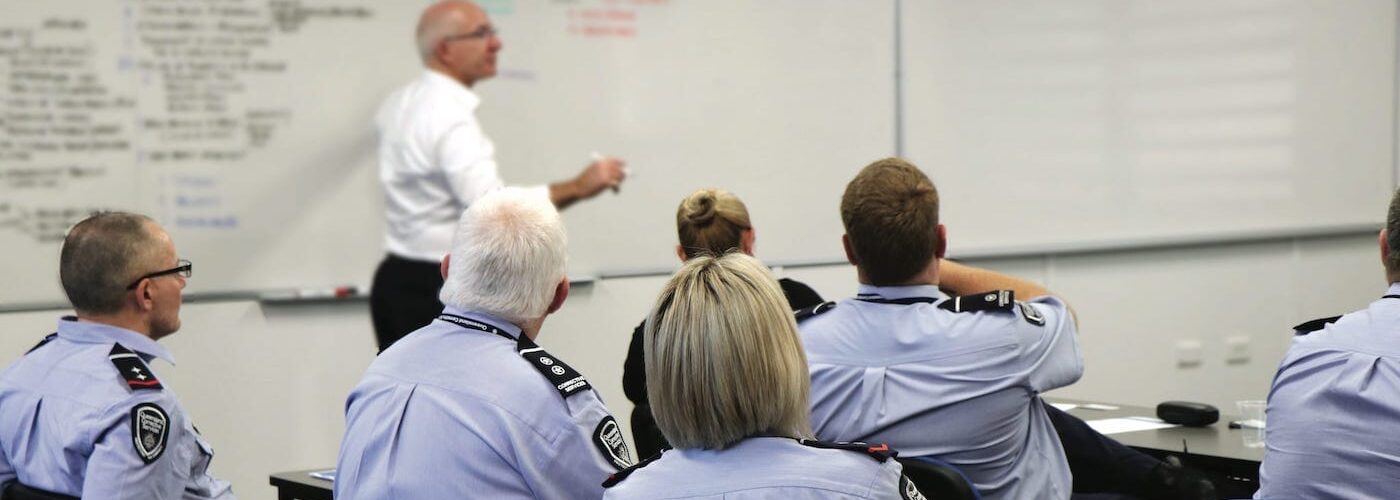
15 Custodial Correctional Officers join the frontline of public safety Officers equipped with highest level of training QCS actively recruiting for a variety of roles Queensland Corrective Services inducted 15 more Custodial Correctional Officers (CCO) to the frontline of public safety today (Friday 19…
Recruits have completed rigorous 10-week Custodial Correctional Officer training for Queensland’s newest correctional centre Officers deployed to other centres until new correctional centre opens More than 800 roles needed to run Lockyer Valley Correctional Centre, including psychologists, case managers, allied health professionals, education officers and…

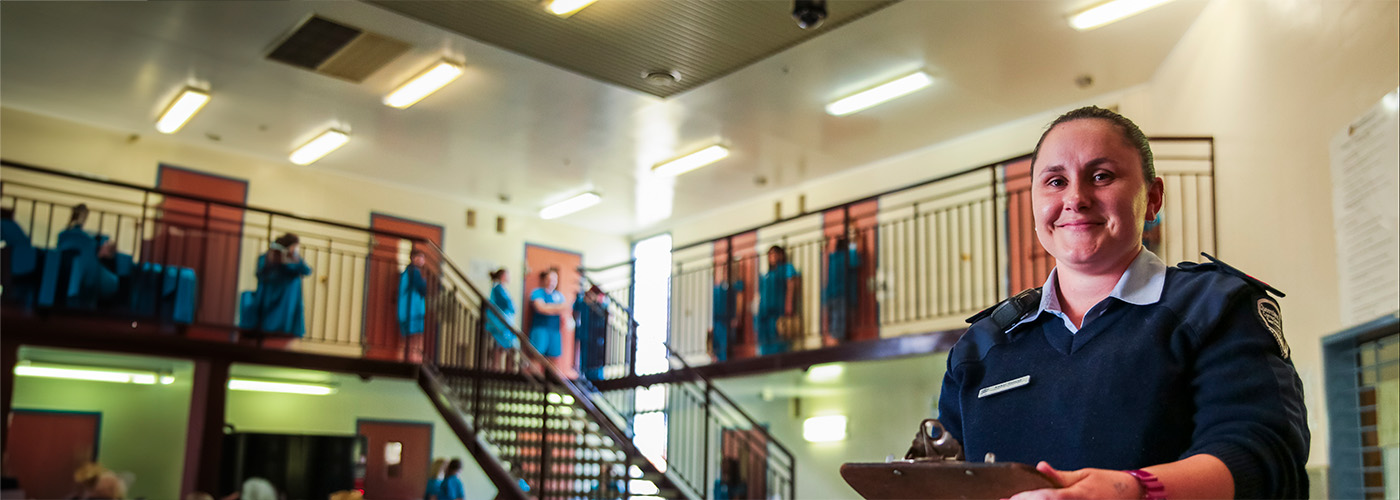
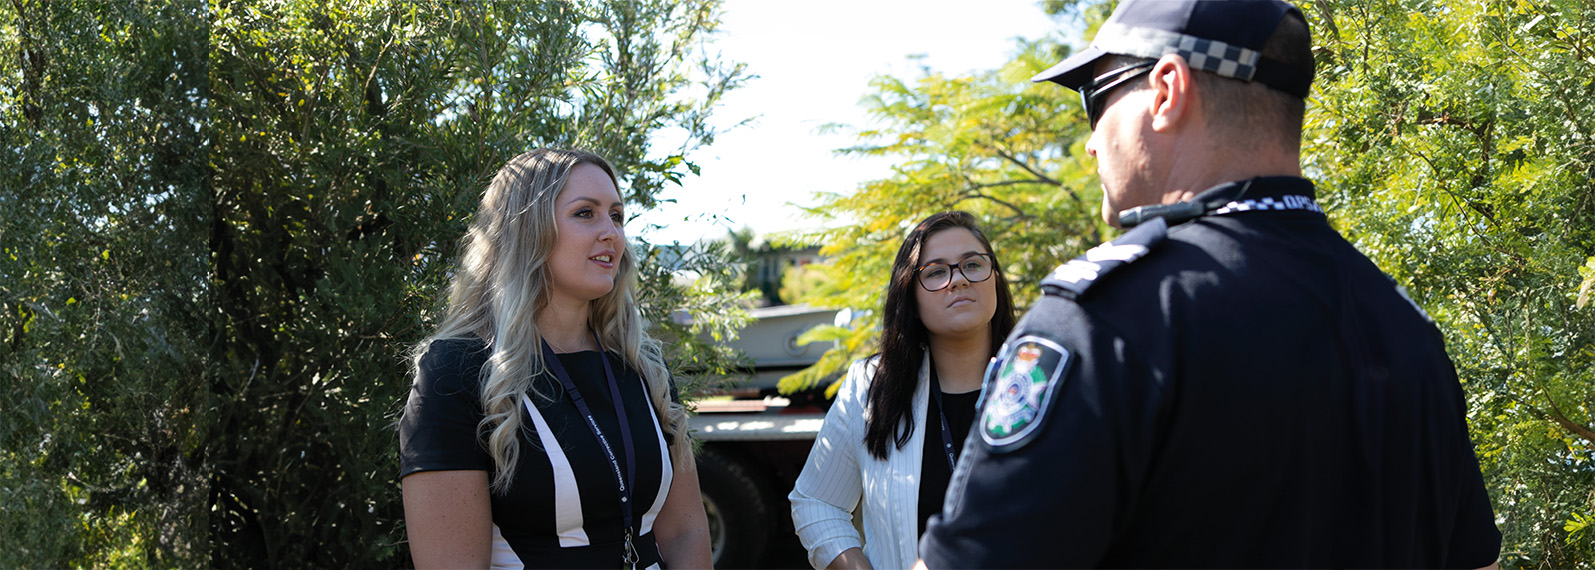
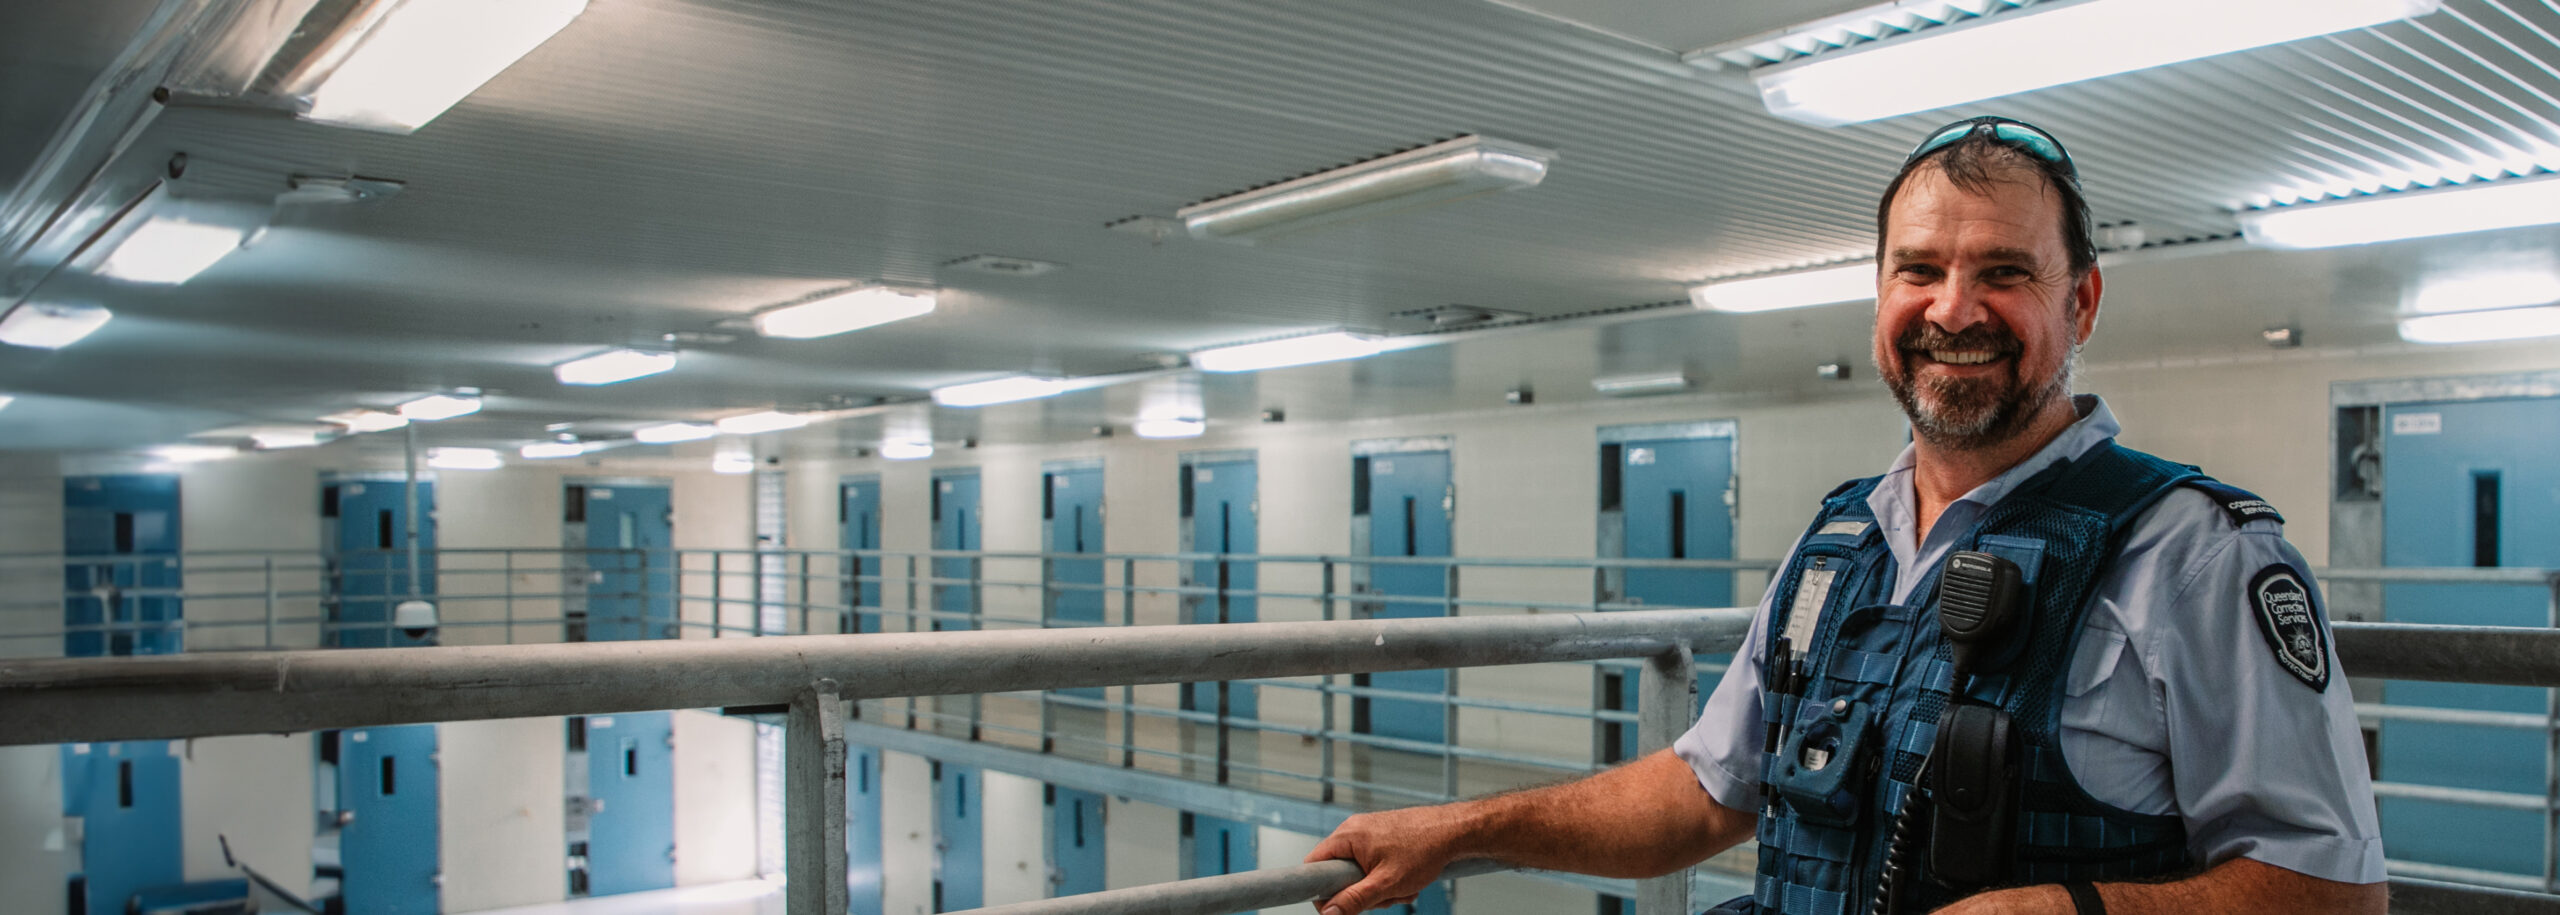
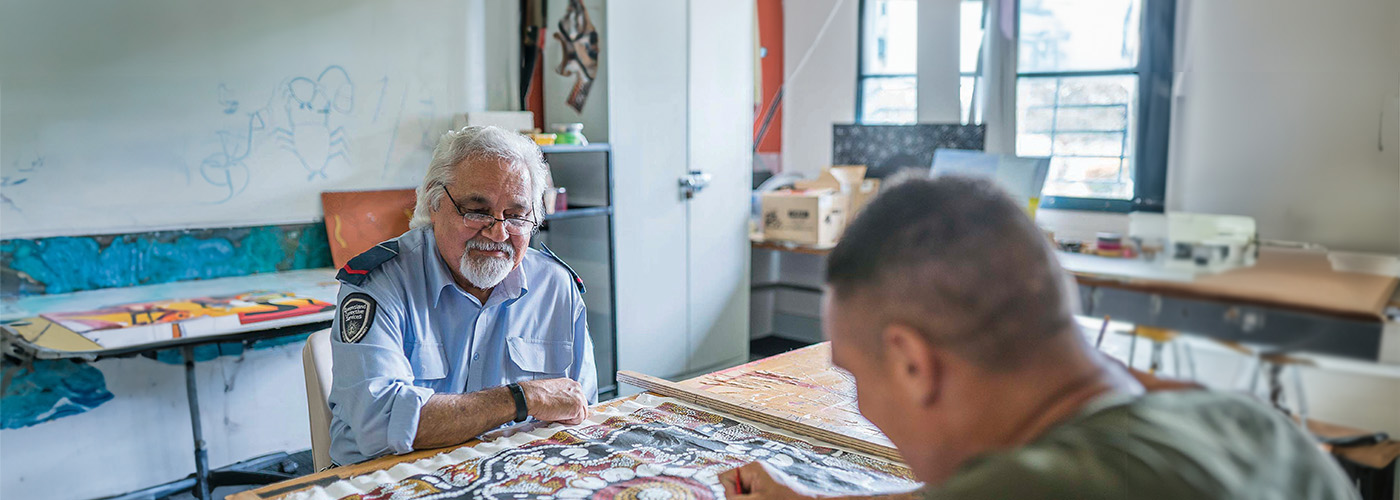
Take a look inside QCS and meet the officers making Queensland safer.

Location: Brisbane Inner City,Brisbane - North,Brisbane - South,Brisbane - East,Brisbane - West,North West Qld,Cairns region,Wide Bay,Far North Qld,Townsville region,Rockhampton region,Sunshine Coast,Ipswich region
Job Type: Permanent
Location: Brisbane Inner City,Brisbane - North,Brisbane - South,Brisbane - East,Brisbane - West,North West Qld,Cairns region,Logan - Beaudesert,Toowoomba region,Wide Bay,Darling Downs - Maranoa,Moreton Bay - North,Moreton Bay - South,Far North Qld,Townsville region,Mackay region,Rockhampton region,Gold Coast,Sunshine Coast,Ipswich region,Central West Qld,South West Qld
Job Type: Fixed Term Temporary
Location: Brisbane Inner City
Job Type: Fixed Term Temporary
Location: Brisbane Inner City
Job Type: Permanent
Location: Brisbane - West,Ipswich region
Job Type: Permanent
Location: Brisbane - West,Toowoomba region,Ipswich region
Job Type: Permanent
Location: Brisbane Inner City,Brisbane - North,Wide Bay,Darling Downs - Maranoa,Moreton Bay - North,Moreton Bay - South,Sunshine Coast
Job Type: Fixed Term Temporary
Location: Brisbane Inner City,Brisbane - North,Toowoomba region,Wide Bay,Darling Downs - Maranoa,Moreton Bay - North,Moreton Bay - South,Sunshine Coast
Job Type: Fixed Term Temporary
Location: Brisbane - North,Wide Bay,Darling Downs - Maranoa,Moreton Bay - North,Moreton Bay - South,Sunshine Coast
Job Type: Permanent
Location: Brisbane Inner City,Brisbane - North,Toowoomba region,Wide Bay,Darling Downs - Maranoa,Moreton Bay - North,Moreton Bay - South,Sunshine Coast
Job Type: Permanent
Location: Brisbane Inner City
Job Type: Fixed Term Temporary
Location: Brisbane Inner City
Job Type: Fixed Term Temporary
Location: Brisbane Inner City,Townsville region
Job Type: Fixed Term Temporary
Location: North West Qld,Wide Bay,Darling Downs - Maranoa,Far North Qld,Mackay region,Rockhampton region,Central West Qld,South West Qld
Job Type: Fixed Term Temporary